MCP Server Tracing and Observability: End‑to‑End Tool Call Debugging in Production
Quick Answer
Learn how to instrument, monitor, and troubleshoot MCP server tool calls with OpenTelemetry, Azure Monitor, and Semantic Kernel for reliable, production‑grade observability.
Quick Answer
MCP server tracing and observability: Learn how to instrument, monitor, and troubleshoot MCP server tool calls with OpenTelemetry, Azure Monitor, and Semantic Kernel for reliable, production‑grade observability.
Uninstrumented Calls Inflate Latency and Mask Errors
In a high‑throughput MCP server, a single un‑instrumented tool call can silently inflate latency, exhaust tokens, and mask upstream failures. The real cost is not the LLM itself but the loss of a single, correlated span that ties the user request, the Semantic Kernel orchestration, and the downstream API call together. Without that link, a 200‑ms timeout in a third‑party API looks like a mysterious “generic error” in your logs and can never be correlated back to the originating user request.
Observability is therefore a contract you enforce between every hop in the pipeline. If you break that contract, you break the SLA you promise to customers in the US and India alike.
From a production perspective, the biggest risk is that a missing span turns a 200‑ms timeout into a 10‑second SLA violation. I'd choose to instrument at the kernel level rather than the HTTP client level because the kernel orchestrates multiple calls and hides the underlying latency. Instrumenting every token is too noisy; instrument at tool level to keep the trace graph manageable.
Real‑World Example: Latency Spike in a Multi‑Region Chatbot
We had a financial advisory chatbot deployed on Azure-openai-integration-with-net-rag-debugging-429s-in-production-20260825" class="internal-link">Azure West US and Central India. After a sudden 3‑second spike in the ExternalRiskScore tool, 12% of user queries failed with a generic error. The only clues were a vague System.Exception in The Logs and a 504 from the risk API. The spike was invisible in the default ASP.NET Core metrics because the tool call happened inside a Semantic Kernel plugin.
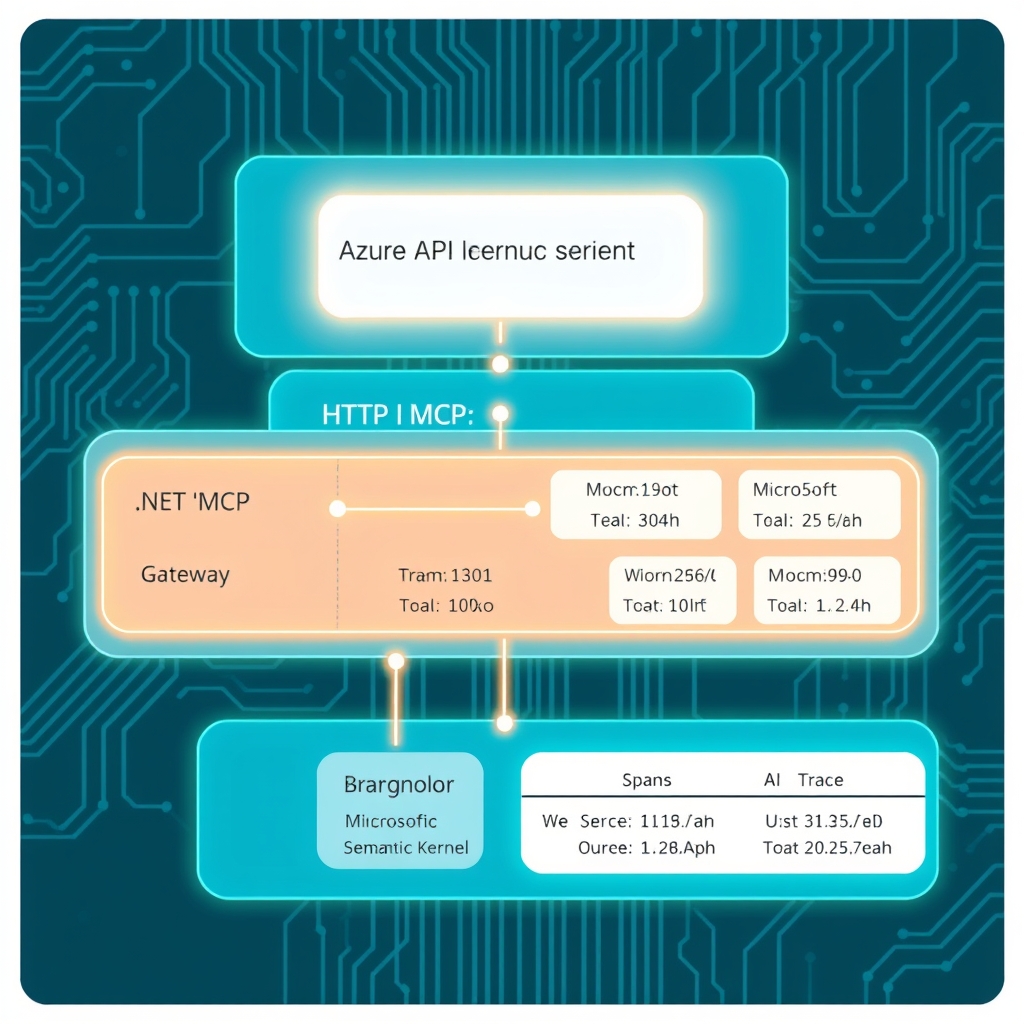
Once we added end‑to‑end tracing, the path emerged: MCP.Request → SemanticKernel.Process → Tool:ExternalRiskScore → HttpClient.GetAsync. The trace revealed that the risk API had introduced a Retry‑After header that the client library ignored, causing the request to hang until the HttpClient timeout fired. The kernel swallowed the timeout and returned a generic error, masking the real cause.
- Propagate context from the gateway to the kernel; otherwise the trace breaks.
- Configure retry logic to honor
Retry‑Afterheaders. - Never swallow exceptions – let the kernel surface them to the caller.
- Use tail sampling for errors to guarantee visibility during spikes.
When This Fails in Production
- Missing
traceparentpropagation between the API gateway and the MCP server. - Inadequate sampling that drops error spans during a traffic surge.
- Cold‑start latency of the
ActivitySourcecausing a 15‑ms jitter that bubbles up to user‑visible latency. - Unbounded span creation in a hot loop (e.g., per token) leading to collector overload.
- Leakage of internal IDs in third‑party logs when
traceparentis forwarded unfiltered.
If you see silent failures, first confirm that the collector is receiving spans and that the exporter isn’t dropping them due to rate limits. I'd avoid assuming the collector is always healthy – add health checks and metrics on the exporter queue size.
Common Mistakes Engineers Make
- Assuming ASP.NET Core automatically propagates context to Semantic Kernel. It does not; you must explicitly pass the
Activity.Currentor use a customActivitySource. - Using the default
HttpClientInstrumentationwithout configuringMaxExportBatchSizeandExportTimeout, leading to back‑pressure on the collector. - Relying on Application Insights only for traces and ignoring the need for custom span attributes that describe tool semantics.
- Over‑instrumenting: wrapping every method call in a span, which bloats the trace graph and skews latency metrics.
- Ignoring the cost model: sending every span to Azure Monitor without sampling causes a 10× increase in ingestion fees.
The most common pitfall is letting the kernel swallow exceptions. I'd avoid wrapping every tool in a try/catch that just logs and continues – it hides the real error and makes debugging harder.
Better Approach Based on Experience
In a production‑ready MCP server I adopt the following pattern:
- Centralize instrumentation. Use a single
ActivitySourcenamedSemanticKernel.ToolCallsfor all tool executions. This keeps the span hierarchy flat and makes filtering by tool name trivial. - Propagate context explicitly. Pass
Activity.Currentinto Semantic Kernel calls; the kernel must expose aWithContextextension that attaches the span to the kernel context. - Leverage OpenTelemetry Collector with Azure Monitor exporter. The collector acts as a buffer; configure
BatchSpanProcessorwith a 5‑second flush interval and a 512‑span batch size to avoid collector overload. - Implement tail sampling for errors. Configure the collector to force export of any span where
tool.status=errororhttp.status_code>=500. This guarantees you always see failures, even if the head sample rate is low. - Sanitize propagation headers. Strip the
traceparentheader before sending it to third‑party APIs unless the partner explicitly supports it. - Pre‑warm the tracer. In the host startup, call
ActivitySource.StartActivity("warmup")to load the provider into memory, shaving 10‑15 ms from the first request after a scale‑up. - Use structured logs enriched with trace IDs. Every log entry that belongs to a tool call should include
traceIdandspanIdso you can cross‑reference logs with traces in a single query.
When I choose a custom ActivitySource over the built‑in SemanticKernel instrumentation, it’s because I need fine‑grained control over attributes or I want to integrate with an existing telemetry pipeline that expects a specific source name. If the kernel already exposes the needed attributes, I’ll stick with the default to keep the codebase lean.
Trade‑offs & Decision Guide
| Decision | Pros | Cons |
|---|---|---|
| OpenTelemetry Collector + Azure Monitor exporter | Vendor‑agnostic code, rich Azure dashboards, future‑proof | Collector deployment overhead, need to tune batch size |
| Azure Monitor (Application Insights) only | Zero‑config for ASP.NET Core, built‑in analytics | Limited custom attributes, less control over sampling |
| Jaeger self‑hosted | Full open‑source stack, no vendor lock‑in | Separate ops stack, logs need separate shipping |
Decision guide:
- If you already use Azure Monitor for logs and metrics, choose Collector + Azure Monitor exporter to keep everything in one place.
- If you need zero ops and are okay with limited custom attributes, go with Application Insights.
- If you run in a multi‑cloud environment and want an open‑source UI, consider Jaeger but be prepared to ship logs separately.
In a multi‑region setup, the overhead of shipping spans across regions can become significant. I'd avoid a single collector that spans all regions unless you’re comfortable with the network cost; a regional collector with a global exporter can reduce latency and cost.
Performance Considerations & Scaling Notes
- Span volume. A 1 kps chatbot can generate >5 k spans per second if you instrument every token. Use head sampling at 1% and tail sampling for errors to keep the collector healthy.
- Collector scaling. Deploy the collector as a stateless pod behind a Kubernetes HPA. Use the
--concurrencyflag to increase the number of worker threads during traffic spikes. - Export latency. Batch export reduces network overhead but introduces a 5‑second delay to the trace data. If you need near‑real‑time visibility for critical tools, use
SimpleSpanProcessorfor those spans only. - Cold start. In serverless environments, cold starts can add 100‑ms. Warm up the tracer in a scheduled function that runs every 5 minutes.
- Cost. Azure Monitor charges per GB of ingested telemetry. With 30 days retention for raw spans, expect ~$0.25 per GB. Keep the sample rate low and purge older spans to Azure Data Explorer for long‑term analysis.
- Use adaptive sampling to adjust the head sample rate based on current traffic; this keeps the collector from being overwhelmed while still capturing critical errors.
- Monitor the exporter queue length – a growing queue is a sign that the collector is falling behind.
By treating tracing as a first‑class citizen—explicitly propagating context, sampling strategically, and correlating logs—you transform a brittle, opaque MCP service into a resilient, observable system that scales from a handful of requests to tens of thousands per minute without breaking SLAs.
Related Articles
- Observability for LLM Apps in ASP.NET Core: Trace First, Metrics
- The Logs Were Missing. So Was the Deploy Pipeline's Connection to the Server — and Nothing Said So.
- Azure OpenAI integration with .NET RAG: Debugging 429s in production
- LLM Cost Control in .NET: Debugging Billing Surprises in Production
- Guardrails and Red‑Teaming for LLM Features in .NET Applications – A Production‑Ready Playbook