AI Architecture Transition from Prototype to Production: A Senior Engineer’s Playbook
Quick Answer
Moving an AI prototype to production demands containerized services, GPU warm‑pools, cost‑aware token caching, and observability with OpenTelemetry to meet latency, cost, and reliability targets.
AI Architecture Transition from Prototype to Production: A Senior Engineer’s Playbook
Quick Answer
AI architecture transition from prototype to production: Moving an AI prototype to production demands containerized services, GPU warm‑pools, cost‑aware token caching, and observability with OpenTelemetry to meet latency, cost, and reliability targets.
From Prototype to Production: The Hidden Bottleneck of AI Architecture
Problem framing
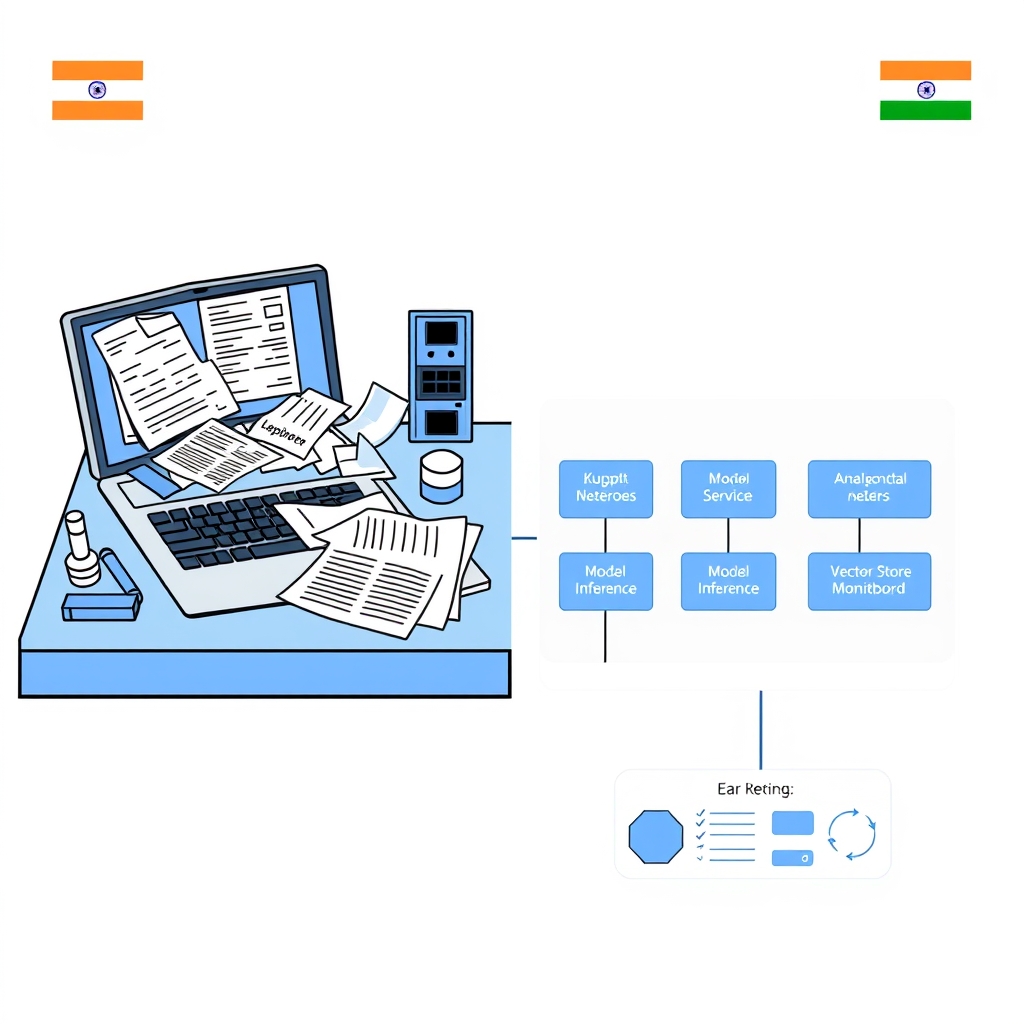
In the prototyping phase we often treat AI services as a single notebook that reads CSVs, calls an LLM, and writes results back to disk. When that notebook is exposed to real users, the hidden assumptions break: the single process cannot scale, the data pipeline is brittle, and the cost model is unbounded. The real challenge is turning that ad‑hoc code into a resilient, observable, and cost‑controlled service that can handle millions of requests per day.
Real‑world example
Consider an Indian fintech SaaS that needs to answer 500 k contextual queries per day. The system must support Azure OpenAI gpt‑4o, a local Mistral model, and domain agents for billing and fraud detection. It has to keep p99 latency under 200 ms, spend less than $10 per million tokens, and guarantee 99.9% uptime. The prototype works on a single VM, but the production environment runs on AKS with GPU nodes, Cosmos DB, and an observability stack.
Trade‑offs
- Monolith vs Microservices: A monolith is quick to build but forces a single scaling unit; microservices give independent scaling but add inter‑service latency and operational overhead.
- Serverless vs Container‑based: Serverless (Azure Functions) eliminates container management but introduces 30–60 s cold starts and limited GPU support; containers give deterministic performance at the cost of more complex CI/CD.
- GPU vs CPU inference: GPUs provide <10 ms per token for large models but are expensive; CPU inference is cheaper but pushes latency beyond the 200 ms budget for high‑volume requests.
- Batch vs Streaming inference: Batching maximizes GPU throughput but increases per‑request latency; streaming keeps latency low but requires stateful connections and careful back‑pressure handling.
- External vs Self‑hosted vector store: Managed services (Azure Cognitive Search, Pinecone) offer rapid deployment but lock you into vendor pricing; self‑hosted Milvus on AKS gives fine‑grained scaling control but demands ops expertise.
Decision guide
| Requirement | Preferred Architecture | Why |
|---|---|---|
| Low latency chat | Containerized Prompt + Model Service on GPU nodes, streaming via WebSocket | Deterministic GPU warm‑up, no serverless cold start |
| High‑throughput embedding generation | Batch inference in Azure Batch + Spark, store in Milvus | Max GPU utilization, cost‑effective compute |
| Cost control | Route to distilled models, cache prompts in Redis, throttle on cost alerts | Reduces token usage, keeps spend predictable |
| Observability | OpenTelemetry + Azure Monitor, per‑token metrics, Hallucination classifier | Fine‑grained telemetry, rapid incident response |
When this fails in production
- Cold‑start latency spikes – GPU pods that are not pre‑warm cause 500 ms+ spikes on the first request of a rolling update.
- Token‑budget overruns – caching is disabled or eviction policy is too aggressive, leading to repeated expensive calls.
- Vector search drift – embedding version mismatch after a tokenizer upgrade causes top‑k results to be irrelevant.
- Circuit‑breaker exhaustion – misconfigured thresholds let a single transient failure cascade into a full outage.
- Security leaks – prompt injection slips through because the sanitiser only checks for a static regex, not semantic context.
Common mistakes engineers make
- Using
new HttpClient()per request – results in socket exhaustion and 503s. - Hard‑coding API keys – leads to accidental leaks in container images.
- Ignoring model versioning – a new LLM release changes token usage, breaking cost budgets.
- Assuming single‑tenant isolation – tenant IDs are omitted from vector collection names, enabling data leakage.
- Relying on a single metric (latency) for health checks – misses cost and hallucination spikes.
Better approach based on experience
- Adopt a contract‑first API design – define OpenAPI specs for every service, enforce
IsSafeflags, and generate server stubs. This prevents downstream consumers from ignoring safety checks. - Use
IHttpClientFactorywith connection pooling – configureMaxConnectionsPerServerto match the GPU pod’s outbound capacity. - Implement per‑tenant vector namespaces – prepend tenant‑id to collection names and enforce Azure AD RBAC. Store a tenant‑metadata table in Cosmos DB for quick lookup.
- Cache prompt completions with a TTL that matches user behavior – 1‑hour TTL for FAQs, 10‑minute TTL for dynamic queries, and use Redis Cluster for high throughput.
- Automate model drift detection – run nightly regression tests that compare token usage and hallucination scores against baseline. If drift >5%, roll back or trigger a retraining pipeline.
- Use a warm‑pool for GPU pods – keep two idle GPU replicas that are pre‑loaded with the model and warmed via a background worker that sends a dummy request every 5 minutes.
- Separate batch and real‑time workloads – run embedding jobs on Azure Batch, push results to Milvus, and expose a read‑only gRPC service for inference. This decouples heavy compute from latency‑sensitive traffic.
- Define multi‑tier cost alerts – P1 for latency, P2 for token spend, P3 for error rate. Automate throttling via Azure API Management when thresholds are breached.
Performance considerations
- Model inference time – gpt‑4o on a 8‑GPU node averages 12 ms/token. For a 200‑token response, that’s 2.4 s on a single GPU; batching 64 requests reduces per‑token time to ~9 ms.
- Network overhead – keep the prompt <1 KB; compress with Brotli before sending to the model service to shave 30 ms.
- Container startup – multi‑stage Dockerfile reduces image size to <300 MB; using
--no‑restart‑policy=Neverduring CI ensures no hidden dependencies. - Vector query latency – Milvus with 8 shards and 4 nodes delivers <50 ms top‑k=10 queries under 10k concurrent users.
Scaling notes
- Horizontal autoscaling – use KEDA with custom metrics (request count, token usage). Scale the Model Service out to 8 replicas during peak hours.
- Vertical scaling for GPU nodes – start with 4 V100 GPUs per node; monitor memory usage; add nodes when GPU utilization <70% for >10 min.
- Statelessness – keep all state in Cosmos DB or Redis; the Prompt Service can be fully stateless, enabling instant pod replacement.
- Disaster recovery – replicate Cosmos DB to a secondary region; use Azure Traffic Manager to switch traffic in <2 min if the primary region fails.
Observability stack
- OpenTelemetry SDK in each service, exporting to Azure Monitor.
- Prometheus scrape for custom metrics:
request_latency_ms,token_usage_total,model_error_rate,hallucination_score. - Distributed tracing across microservices, visualised in Azure Monitor Workbooks.
- Alert rules: p99 latency >250 ms, token spend >120% budget, error rate >0.5%.
Conclusion
Transitioning from a notebook prototype to a production‑ready AI service is not a matter of “just deploy it”. It requires a deliberate shift in mindset: treat every assumption as a potential failure point, instrument everything, and build in cost controls from the outset. By applying the trade‑offs above, using a contract‑first API, and automating drift detection, you can keep latency under control, avoid hidden cost overruns, and scale to millions of requests without blowing your budget or compromising reliability.
What are the main architectural differences between a notebook prototype and a production AI service?
Prototypes run as a single notebook with local CSVs and no orchestration. Production requires stateless micro‑services, containerized workloads, persistent storage, CI/CD pipelines, and full observability.
How do you mitigate GPU cold starts in a containerized environment?
Maintain a warm‑pool of pre‑loaded GPU pods, expose them via readiness probes, and send periodic dummy requests to keep the model loaded in memory, eliminating 30–60 s cold‑start spikes.
What strategies balance batch and streaming inference while meeting latency budgets?
Use short batch windows (e.g., 32 requests or 5 s) for embeddings to maximise GPU throughput, and stream chat responses via WebSocket for per‑request latency under 200 ms.
How can you enforce cost controls and avoid token budget overruns in production?
Implement token‑budget alerts, cache prompt completions in Redis with appropriate TTLs, route expensive calls to distilled models, and rotate API keys to keep spend predictable.
What observability metrics are essential for monitoring AI model performance and safety?
Track request latency (p99), token usage per request, model error rate, hallucination score, GPU utilisation, and cost per million tokens; instrument with OpenTelemetry and export to Azure Monitor.
What to Ship
- Containerize the inference microservice with Docker, exposing a gRPC endpoint, and deploy it to a Kubernetes cluster with a Horizontal Pod Autoscaler tuned to 10 requests/sec per pod.
- Integrate MLflow to tag every model artifact with a unique version and commit hash, and expose the model registry as a REST API for downstream services.
- Set up an Evidently-based data‑drift monitoring job that runs nightly, flags any drift above 0.1 in the input distribution, and triggers an automated rollback to the last stable model.
- Implement a feature‑flag layer (e.g., LaunchDarkly) that allows rolling out new model versions to 5% of traffic, with a clear cut‑over plan to 100% once confidence thresholds are met.
- Configure a CI/CD pipeline that automatically builds the Docker image, runs unit tests against a mock dataset, and pushes the image to a private registry before triggering a blue‑green deployment via ArgoCD.
- Add a circuit‑breaker and rate‑limiter middleware to the API gateway, configured to open the circuit after 5 consecutive 5xx responses and to limit clients to 100 requests per minute.
Related Articles
- NVIDIA NOOA and NVIDIA OpenShell sandboxing code-executing agents: A Production‑Ready Guide
- Securing Multi-Agent Systems with .NET and Azure AI Foundry: Threats, Vulnerabilities, and Mitigation Strategies
- Cloudflare Workers vs AWS Lambda: Real-World Performance Benchmarking
- Why Agentic AI in .NET Fails in Production: A Comprehensive Guide
- Designing Effective AI Agent Architecture for .NET Applications
Frequently Asked Questions
What are the main architectural differences between a notebook prototype and a production AI service?
Prototypes run as a single notebook with local CSVs and no orchestration. Production requires stateless micro‑services, containerized workloads, persistent storage, CI/CD pipelines, and full observability.
How do you mitigate GPU cold starts in a containerized environment?
Maintain a warm‑pool of pre‑loaded GPU pods, expose them via readiness probes, and send periodic dummy requests to keep the model loaded in memory, eliminating 30–60 s cold‑start spikes.
What strategies balance batch and streaming inference while meeting latency budgets?
Use short batch windows (e.g., 32 requests or 5 s) for embeddings to maximise GPU throughput, and stream chat responses via WebSocket for per‑request latency under 200 ms.
How can you enforce cost controls and avoid token budget overruns in production?
Implement token‑budget alerts, cache prompt completions in Redis with appropriate TTLs, route expensive calls to distilled models, and rotate API keys to keep spend predictable.
What observability metrics are essential for monitoring AI model performance and safety?
Track request latency (p99), token usage per request, model error rate, hallucination score, GPU utilisation, and cost per million tokens; instrument with OpenTelemetry and export to Azure Monitor.